MoldUDP64 and ITCH testbench
Table of Contents
Introduction #
In this post, I will be going over the testing for the MoldUDP64 and ITCH
modules. This article is best read after having read the post on designing the
MoldUDP64 module and ITCH module.
Although both the ITCH and MoldUDP64 modules have their own small SystemVerilog
test benches, these test benches are relatively simple and do not offer
extensive testing coverage. Additionally, they are limited to a single block,
and experience has taught me that a lot can go wrong when connecting different
modules. The goal of this top-level test bench is to provide more comprehensive
testing for each block and test the system as a whole.
The goal when designing this top-level test bench was to simulate the driving
signals our hardware would encounter if it were connected directly to the
NASDAQ data feed. To closely match real-world behavior within the constraints
of my nonexistent budget, our test bench will recreate data feed packets based
on NASDAQ-provided logs containing ITCH messages captured at the exchange.
NASDAQ generously provides these files free of charge, and they can be found
here.
RTL design for a nasdaq compatible high frequency trading low level. Supports itch on moldudp64.
Architecture #
The NASDAQ data feed directly updates participants on changes in the status via
ITCH messages. These messages are delivered by MoldUDP64 packets. A single
MoldUDP64 packet can contain multiple ITCH messages.
The objective of our testbench will be to read this dump file and extract the
ITCH messages. We will then recreate a MoldUDP64 packet containing multiple
of these messages and break it down into smaller payloads of the corresponding
size to the UDP -> MoldUDP64 data width and feed them through the simulator.
In parallel, the testbench will decode the ITCH message and produce the next
expected ITCH module decoder output. This expected outcome will be compared
to the actual ITCH module output, completing the self-testing loop.
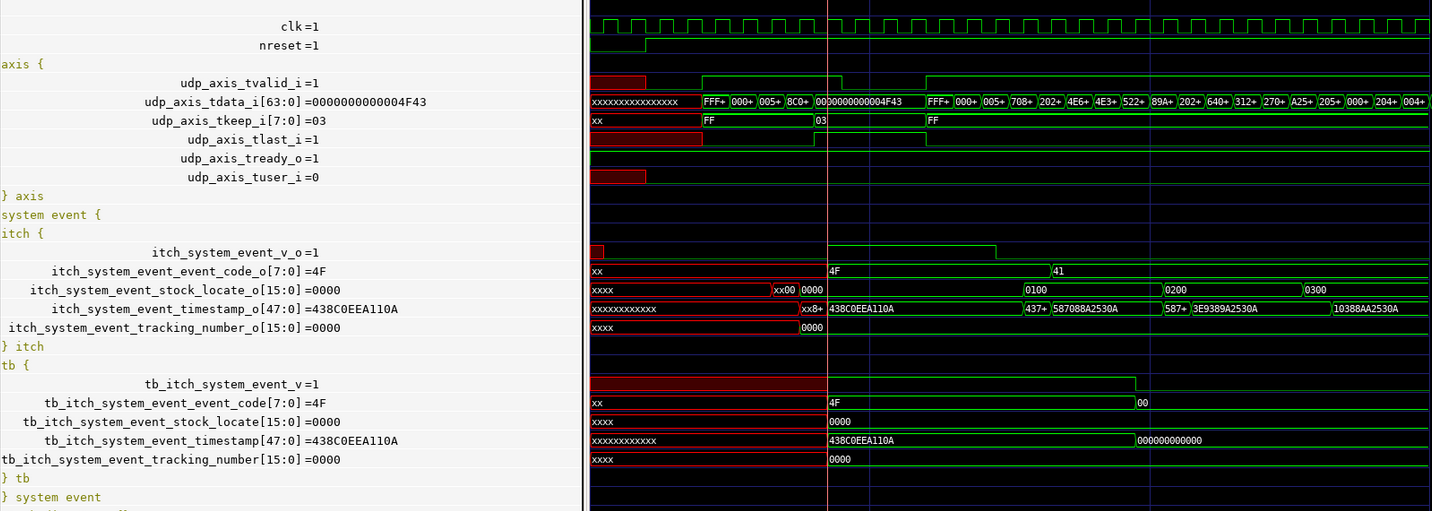
ITCH system event message. We can observe two different ITCH message interfaces: the itch_* signals are driven by the ITCH RTL module, while the tb_itch_* signals contain the expected ITCH decoded values and are driven by our testbench. The values of these two groups are compared during the checking process.NASDAQ ITCH file
#
During the testbench initialization, the user will
provide the path to the NASDAQ ITCH dump file.
This NASDAQ-provided dump file contains multiple ITCH messages stored using
the NASDAQ-specified BinaryFILE format.

BinaryFILE format.Each payload contains a single ITCH message in its raw binary format.
Since reading these files and decoding the ITCH messages are operations I
perform in other contexts, the code for these operations is in my
TotalView-ITCH 5.0 library.
Small C library to handle itch messages
Fake MoldUDP64 packet
#
Each of our MoldUDP64 packets contains a random number of ITCH messages
extracted from the dump file. For each ITCH message that is added to the
packet, we push the expected decoded ITCH module output to a FIFO to be
dequeued later during checking.

MoldUDP64 package format, containing multiple ITCH messages.Once this new MoldUDP64 packet has been created, we then ‘flatten’ the
intermediate C structure representation into its binary format.
During simulation, if the MoldUDP64 signals it is ready to accept a new
payload, the testbench will write at most the next 64 bits (or data bus width
between the UDP -> MoldUPD64) onto the bus.
Decoded output checking #
Within a few cycles of simulation, the ITCH module will have received a full
message and will drive it on its outbound interface.
At this moment, we will
dequeue the expected ITCH decoded signals we stored earlier when creating the
MoldUDP64 packet onto a series of testbench-driven signals that mirror the real
ITCH outbound interface.
We will then compare the testbench-driven expected outbound signal values with the values obtained from the logic. This checking is performed in the SystemVerilog part of the testbench using a series of assertions.
`assert_stop( tb_itch_system_event_v == itch_system_event_v_o);
`assert_stop( ~tb_itch_system_event_v | tb_itch_system_event_v & tb_itch_system_event_stock_locate == itch_system_event_stock_locate_o);
`assert_stop( ~tb_itch_system_event_v | tb_itch_system_event_v & tb_itch_system_event_tracking_number == itch_system_event_tracking_number_o);
`assert_stop( ~tb_itch_system_event_v | tb_itch_system_event_v & tb_itch_system_event_timestamp == itch_system_event_timestamp_o);
`assert_stop( ~tb_itch_system_event_v | tb_itch_system_event_v & tb_itch_system_event_event_code == itch_system_event_event_code_o);
If both the message type and the decoded message fields content match, the check is successful; otherwise, the assertion will trigger.
Liveness #
In our testbench, we are practically always sending valid payloads to the
MoldUDP64 module, but during testing, a few bugs caused long periods without a
valid ITCH decoded message.
To quickly detect these cases and simplify tracking down these bugs, a liveness counter was added.
It is reset whenever a valid
ITCH message is decoded and will trigger an assertion once it reaches 0.
Test bench #
Our top-level testbench is coded using a mix of C and SystemVerilog and runs
using the Icarus Verilog (iverilog) simulator. The C code interfaces with the
simulator using the Verilog Procedural Interface (VPI).
Using this approach is
particularly convenient, as it allows me to build much more complex testbenches
than I could with SystemVerilog alone and also enables easy reuse of my code
base.
For illustration, this testbench uses my C TotalView-ITCH 5.0 library
for parsing the NASDAQ log file.
Verilog Procedural Interface (VPI) #
In practice, the C code is compiled and linked into a shared object, which is
loaded at runtime by the simulator.
As this is a shared object, we must compile our .o to be position
independent. This is done using the -fpic compile flag:
FLAGS = -fpic

moldudp64.o: moldudp64.c moldudp64.h
    $(CC) -c moldudp64.c $(FLAGS)
To link to the target vpi format I am using the -shared and -lvpi flags :
tb.vpi: tb.o tb_utils.o tb_itch.o tv.o moldudp64.o axis.o tb_rand.h tb_config.h libitch.a
    $(LD) -shared -o tb.vpi tb.o tv.o axis.o moldudp64.o tb_utils.o tb_itch.o $(LIB) -lvpi
When launching the iverilog simulation I specify the vpi’s name and
directory using the -m<vpi_file> and -M <vpi_dir> arguments :
run: test vpi
    vvp -M $(VPI_DIR) -mtb $(BUILD)/hft_tb
Please note, the VPI interface is simulator-specific, so the earlier snippets
are only applicable with iverilog.
As of writing, I have not added support for verilator to this
testbench. If readers want to see an example of a VPI-enabled testbench with
dual iverilog and verilator support, I would point you towards my
Ethernet Physical Layer testbench.
sha1: 28a1a6a9fc1a0033b5cac89fde349a17266c27c7
Upon loading, using VPI, we register four new custom system functions with the simulator.
Each time these are reached in simulation, the corresponding C code is called.
These are $tb_init, $tb, $tb_itch, and $tb_end. They can be called like
any other system function. For reference, $random is a system function.
$tb_init
#
$tb_init is used to initialize the C part of the testbench and allows the
user to provide the path to the NASDAQ ITCH dump file to be used in this
simulation.
If the file cannot be found, the simulation aborts.
Usage :
$tb_init("<nasdaq_file_path>");
$tb
#
$tb simulates a 64 bit axis bus between a hypothetical UDP block to the
MoldUDP64 module.
Usage :
logic        axis_ready;
logic        axis_valid;
logic [63:0] axis_data;
logic [7:0]  axis_keep;
logic        axis_last;

logic        tb_finished;

$tb(axis_ready, axis_valid, axis_data, axis_keep,axis_last, tb_finished);
It reads the axis_ready driven by the
MoldUPD64 and correspondingly writes the content of axis_valid,
axis_data, axis_keep and axis_last. It also writes out a tb_finished
signal to indicate the C testbench has reached the end of the ITCH file and we
can safely stop the simulation.
$tb_itch
#
$tb_itch drives the expected values on the duplicate ITCH outbound
interface. Whenever a new ITCH message is decoded these values are compared
with the actual output of the ITCH module to check for any differences.
Usage :
$tb_itch(<duplicate_itch_outbound_interface>);
Conclusion #
This top-level testbench allowed me to verify the behavior of the MoldUDP64 and
ITCH modules in much more depth than the smaller block-level testbenches ever
could.
Its next upcoming evolution will likely be to add support for verilator for
faster iteration time and eventually integrate the MAC, IPv4, and UDP modules.